|
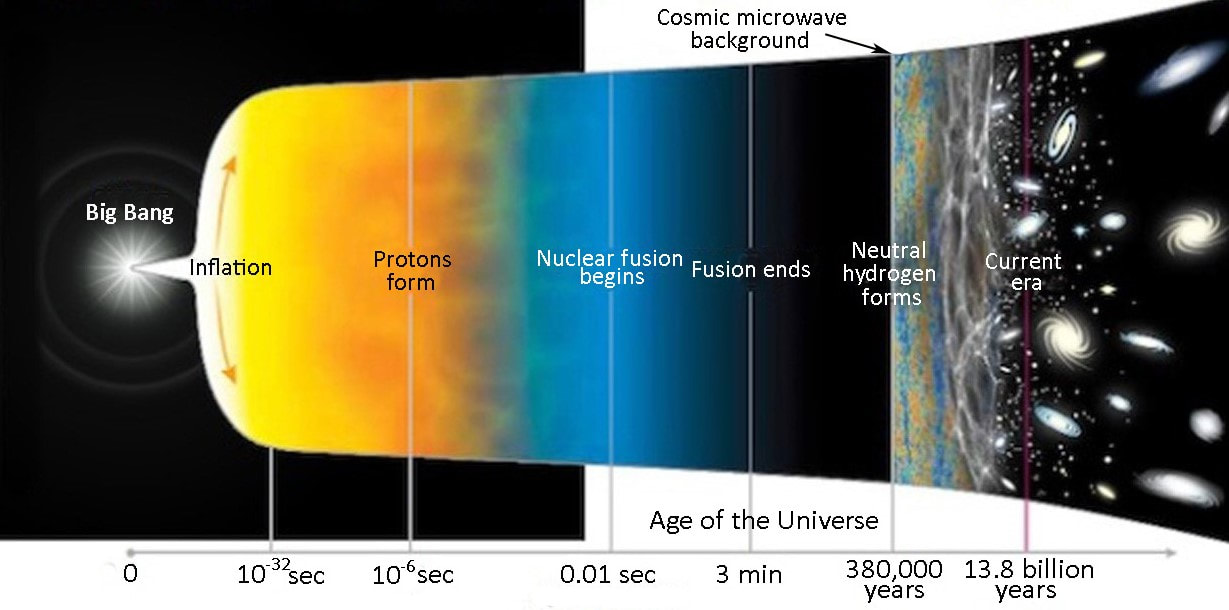
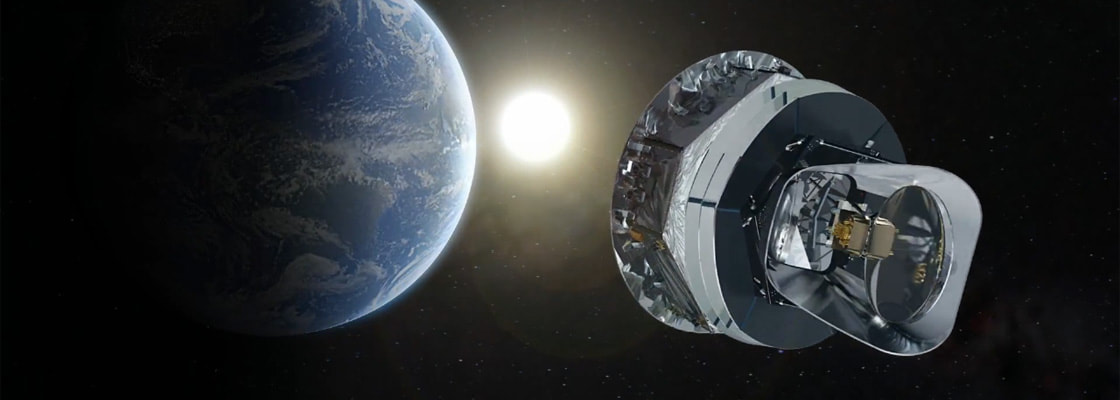
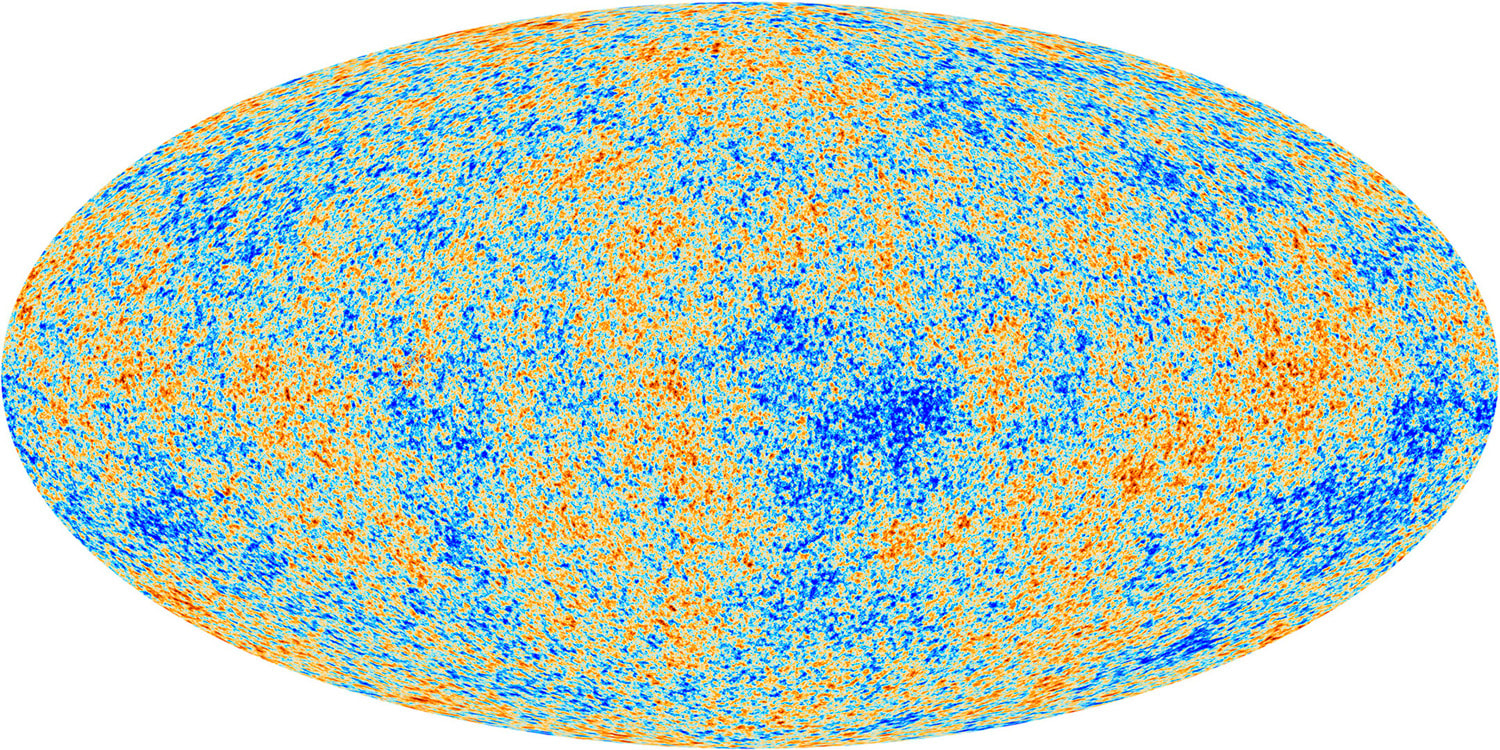
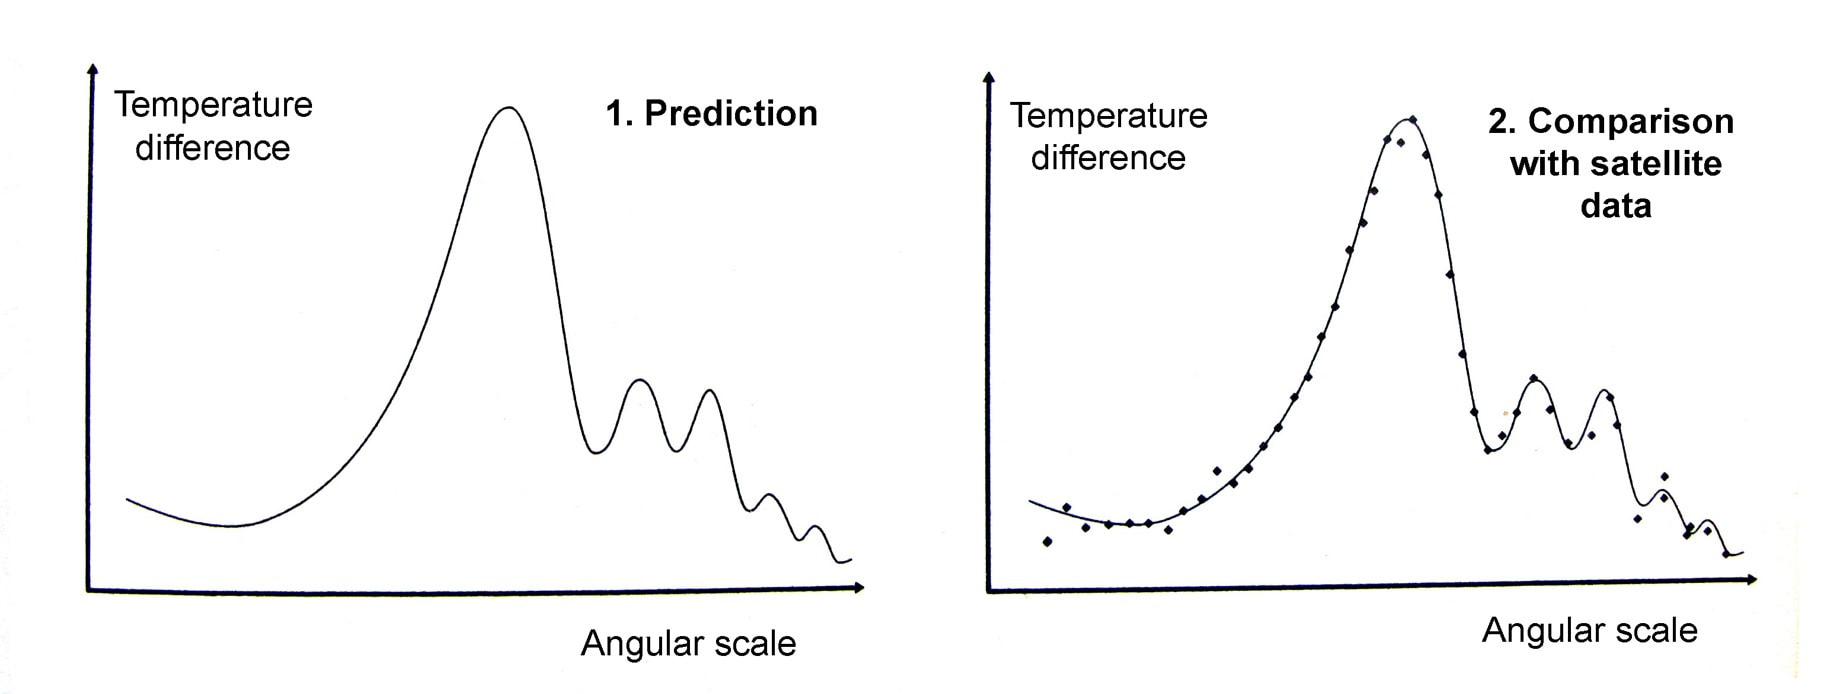
Graham writes … This question has occupied cosmologists since the theory of cosmic inflation was first developed by Alan Guth in 1979, who realised that empty space could provide a mechanism to account for the expansion of the Universe. In the theory it is assumed that a tiny volume of space-time in the early Universe – very much smaller than a proton – came to be in a ‘false vacuum’ state. Effectively, in this state space is permeated by a large, constant energy density. The effect of this so-called ‘inflaton field’ is to drive a rapid expansion of space-time for as long as the false vacuum state exists. I won’t go into the detail of how this happens here (1), but as a consequence the tiny nugget of space-time grows exponentially, before the energy density decays to acquire a ‘true vacuum’ state once again, bringing the inflationary period to an end. Theoretically, this expansion takes place between roughly 10 to the power -36 (10e-36) sec (2) and 10e-32 sec after the bang (ATB) – periods of time that makes the blink of an eye seem like an eternity. To generate a universe with the characteristics we observe today, the expansion factor must be of the order of 10e+30. To give an impression of what this degree of expansion means, if you expand a human egg cell by a factor of 10e+25, you get something about the size of the Milky Way galaxy! The diagram below helps, I think, to illustrate the time line of developments ATB. Clearly the horizontal time axis is not linear!  Georges Lemaître (left) with Albert Einstein. Lemaître was a Belgium priest and physicist. Credit: public domain. Georges Lemaître (left) with Albert Einstein. Lemaître was a Belgium priest and physicist. Credit: public domain. To me, the events of the inflation era seem extraordinary, prompting the question in the title of this post. However unlikely these events may seem, the cosmic inflation paradigm has been very successful in resolving problems which have dogged the ‘conventional’ theory of the big bang as originally proposed by Georges Lemaître in 1927 (3), for example, the horizon and flatness problems. A summary of these issues, and others, can be found here. When we use Einstein’s field equations of general relativity, we make an assumption that on cosmic scales of billions of light years, the Universe is homogeneous and isotropic. In other words, it appears the same at all locations and in all directions. These simplifying symmetries are what allows us to use the mathematics to study the large-scale dynamics of the Universe. A nice analogy is to think of the Universe as a glass of water, and each entire galaxy as a molecule of H2O. In using the equations, we are examining the glass of water, and ignoring the small-scale molecules. However, cosmology at some point has to come to terms with the idea that when you examine the Universe at smaller scales you find clumpy structures like galaxies. And here we are faced with a conundrum. The primary question addressed in this post is along the lines of ‘what is the origin of the inhomogeneities that led to the development of the clumpy structures like galaxies and stars that we observe today?’ Without these, clearly we would not be here to contemplate the issue. If we assume that cosmic inflation occurred, then the initial ‘fireball’ would be microscopically tiny. Its extreme temperature and energy density, just ATB but before the inflationary expansion, would be able to reach equilibrium smoothing out any variations. So, the question posed above becomes key. If the resulting density and temperature of the inflated universe was uniform, then how did galaxies form? Where did the necessary inhomogeneities come from? It is gratifying that the inflation theory offers progress in answering this question – indeed, remarkably, the initial non-uniformities that gave rise to galaxies and stars may have come from quantum mechanics!  Werner Heisenberg. Credit: Bundesarchiv / public domain. Werner Heisenberg. Credit: Bundesarchiv / public domain. This magnificent idea arises from the interplay between inflationary expansion and the quantum uncertainty principle. The uncertainty principle, originally proposed by Werner Heisenberg, says that there are always trade-offs in how precisely complementary physical quantities can be determined. The example most often quoted involves the position and speed of a sub-atomic particle. The more precisely its position is determined, the less precisely it speed can be determined (and the other way round). However, the principle can also be applied to fields. In this case, the more accurate the value of a field is determined, the less precisely the field’s rate of change can be established, at a given location. Hence, if the field’s rate of change cannot be precisely defined, then we are unable to determine the field’s value at a later (or earlier) time. At these microscopic scales the field’s value will undulate up or down at this or that rate. This results in the observed behaviour of quantum fields – their value undergoes a characteristic frenzied, random jitter, a characteristic often referred to as quantum fluctuations. This takes us back then to the inflaton field that drives the dramatic inflationary expansion of the early Universe. In the discussion in the book (1), as the inflationary era is drawing to a close it is assumed that the energy of the field decreased and arrived at the true vacuum state at the same time at each location. However, the quantum fluctuations of the field’s value means that it reaches its the value of lowest energy at different places at slightly different times. Consequently, inflationary expansion shuts down at different locations at different moments, resulting in differing degrees of expansion at each location, giving rise to inhomogeneities. Hence, inflationary cosmology provides a natural mechanism for understanding how the small-scale nonuniformity responsible for clumpy structures like galaxies emerge in a Universe that on the largest scales is comprehensively homogeneous. 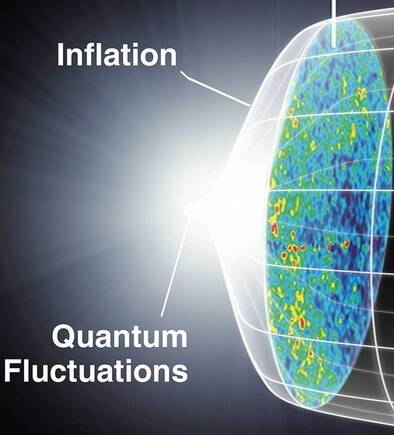 The cosmic microwave background was created at around 380,000 years ATB. 3D space is represented here as a 2D disk imprinted with temperature fluctuations. Credit: Source unknown. The cosmic microwave background was created at around 380,000 years ATB. 3D space is represented here as a 2D disk imprinted with temperature fluctuations. Credit: Source unknown. So quantum fluctuations in the very early Universe, magnified to cosmic size by inflation, become the seeds for the growth of structure in the Universe! But is all this just theoretical speculation, or can these early seeds be observed? The answer to this question is very much ‘yes!’. In 1964 two radio astronomers, Arno Penzias and Robert Wilson made a breakthrough discovery (serendipitously). The two radio astronomers detected a source of low energy radio noise spread uniformly across the sky, which they later realised was the afterglow of the Big Bang. This radiation, which became know as the cosmic microwave background (CMB), is essentially an imprint of the state of the Universe at around 380,000 years ATB (4). Initially the Universe was a tiny, but unimaginably hot and dense ‘fireball’, in which the constituents of ‘normal matter’ – protons, neutrons and electrons – were spawned. Initially electromagnetic (EM) radiation was scattered by its interaction with the charged particles so that the Universe was opaque. However, when the temperature decreased to about 3,000 degrees Celsius, atoms of neutral hydrogen were able to form, and the fog cleared. At this epoch, the EM radiation was released to propagate freely throughout the Universe. Since that time the Universe has expanded by a factor of about one thousand so that the radiation’s wavelength has correspondingly stretched, bringing it into the microwave part of the EM spectrum. It is this remnant radiation that we now call the CMB. It is no longer intensely hot, but now has an extremely low temperature of around 2.72 Kelvin (5). This radiation temperature is uniform across the sky, but there are small variations – in one part of the sky it may be 2.7249 Kelvin and at another 2.7251 Kelvin. So the radiation temperature is essentially uniform (the researchers call it isotropic), but with small variations as predicted by inflationary cosmology.  Max Planck. Credit: public domain. Max Planck. Credit: public domain. Maps of the temperature variations in the CMB have been made by a number of satellite missions with increasing accuracy. The most recent and most accurate was acquired by ESA’s Planck probe, named in honour of Max Planck, one of the pioneering scientists that developed the theory of quantum mechanics. The diagram below displays the primary results of the Planck mission, showing a colour coded map of the CMB temperature fluctuations across the sky. Note that these variations are small, amounting to differences at the millidegree level (6). This map may not look very impressive to the untrained eye, but it represents a treasure trove of information and data about the early Universe which has transformed cosmology from the theoretical science it used to be to a science based on a foundation of observational data. The final icing on the cake is what happens when you carry out calculations based on the predictions of quantum mechanics that we discussed earlier. The details are not important here, but diagram 1 shows the prediction where the horizontal axis shows the angular separation of two points on the sky, and the vertical axis shows their temperature difference. In diagram 2 this prediction is compared with satellite observations and as you can see there is remarkable agreement! This success has convinced many physicists of the validity of inflationary cosmology, but many remain to be convinced. Despite the remarkable success of the theory, the associated events that occurred 13.8 billion years ago seem to me to be extraordinary. And then, of course, there is also the issue of the origin and characteristics of the inflaton field that kicked it all off.
Despite all this, however, I am blown away by the notion that the 100 billion or more galaxies in our visible Universe may be ‘nothing but quantum mechanics writ large across the sky’, to quote Brian Greene (7) Graham Swinerd Southampton, UK May 2023 (1) Graham Swinerd and John Bryant, From the Big Bang to Biology – where is God?, Kindle Direct Publishing, 2020, see Section 3.6 for more detail. (2) In the website editor, I am unable to use the usual convention of employing superscripts to represent ‘10 to the power of 30’ for example. In the text I have used the notation 10e+30 to denote this. (3) Georges Lemaître’s publication of 1927 appeared in a little-known Belgium journal. It was subsequently published in 1931 in a journal of the Royal Astronomical Society. (4) Graham Swinerd and John Bryant, From the Big Bang to Biology: where is God?, Kindle Direct Publishing, 2020, pp. 60 – 63 for more details about the CMB. (5) The Kelvin temperature scale is identical to the Celsius scale but with zero Kelvin at absolute zero (-273 degrees Celsius). Hence, for example, water freezes at +273 Kelvin and boils at +373 Kelvin. (6) A millidegree is 1 thousandths of a degree. (7) Brian Green, The Fabric of the Cosmos, Penguin Books, 2004, pp. 308-309.
0 Comments
Leave a Reply. |
AuthorsJohn Bryant and Graham Swinerd comment on biology, physics and faith. Archives
July 2024
Categories |


 RSS Feed
