|
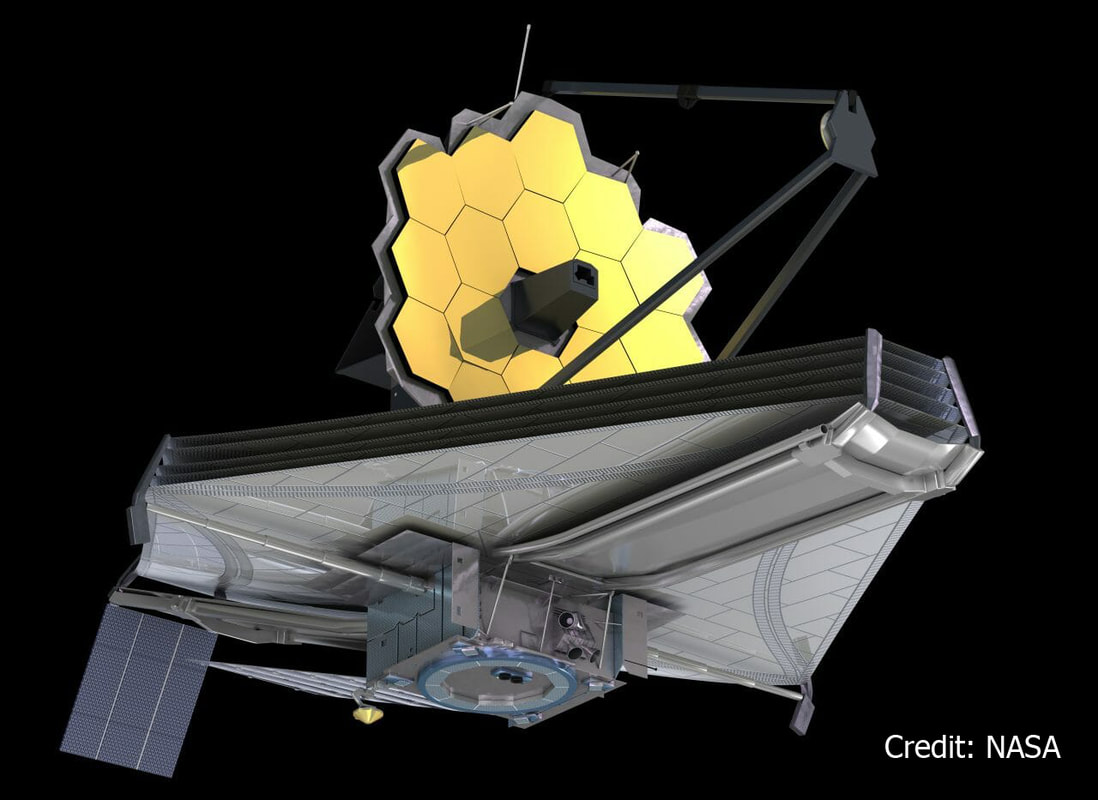
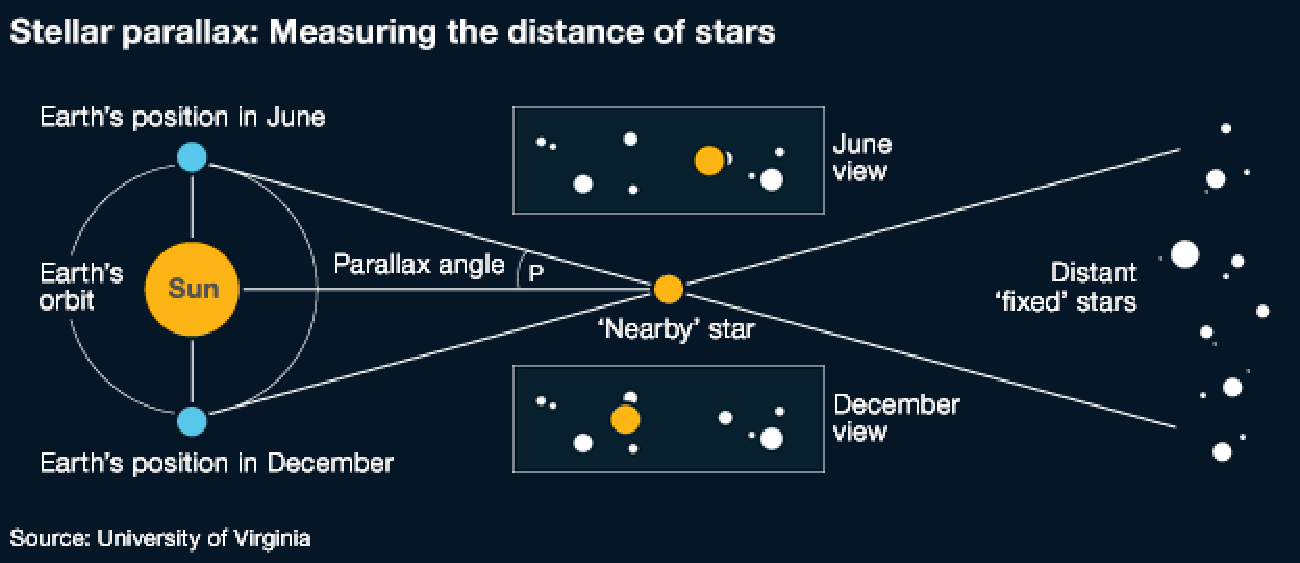
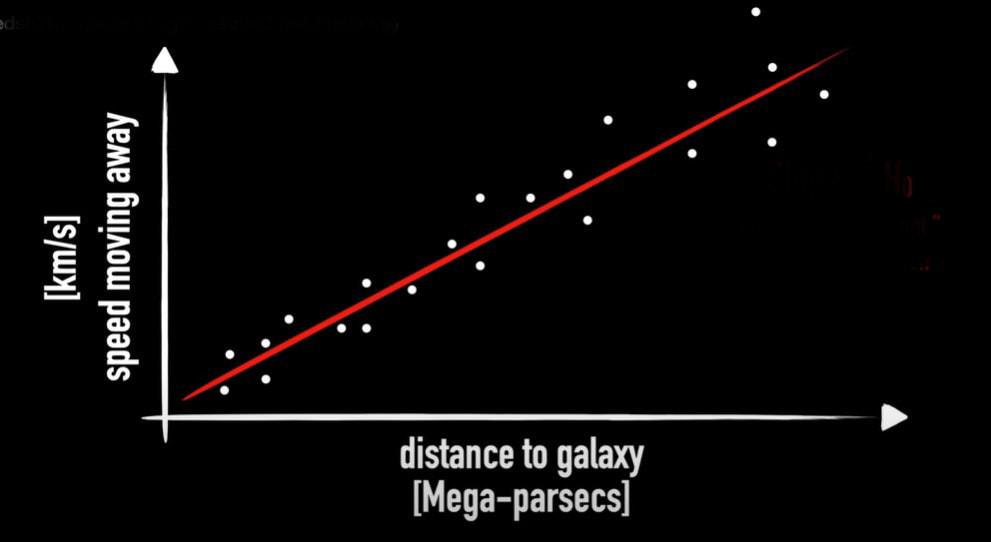
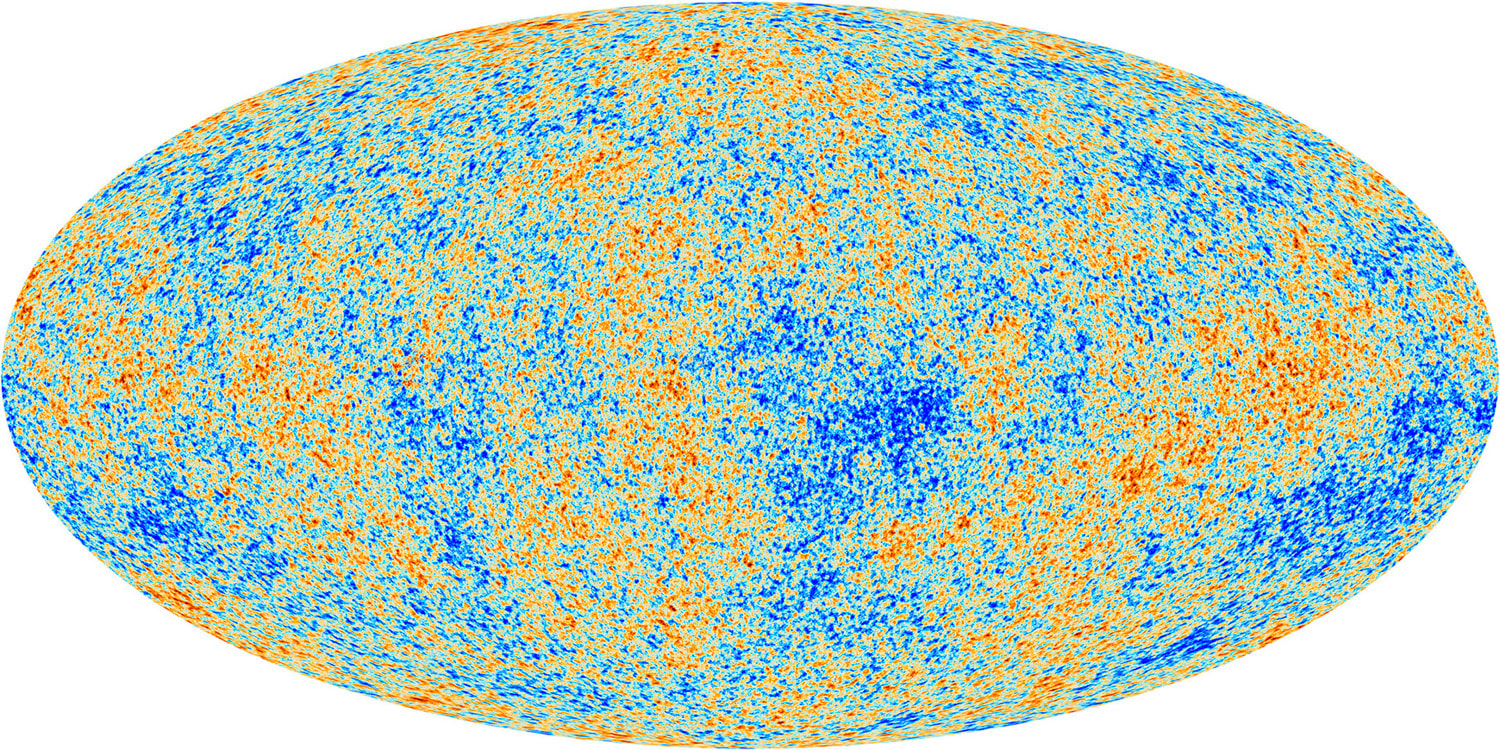
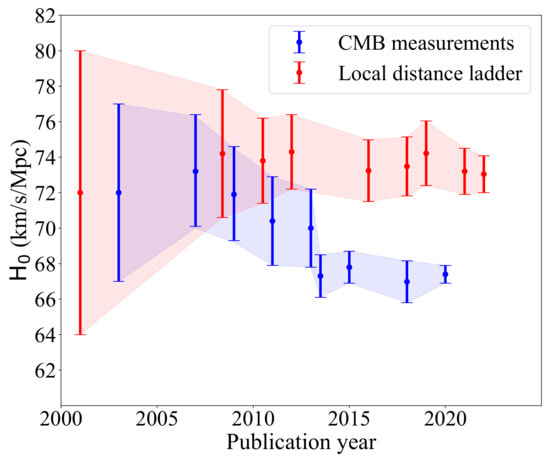
Graham writes ...  Credit: freepik.com Credit: freepik.com Since the James Webb Space Telescope (JWST) started doing the business, there has been a deluge of rather dubious reports on social media about a variety of crises in cosmology. For example, there have been statements that the telescope has proven that the Big Bang didn’t happen, that the Universe is twice as old as we thought it was, that the very early massive galaxies that JWST has observed are physically impossible, and so on! First, let me reassure you that these ‘stories’ are not true. When we look at the details, it’s clear that this amounts to rumour-mongering or ‘false news’! That’s not to say that the status quo – the standard model of cosmology – is sacrosanct. I’m sure that the new space observatory will make observations that will genuinely challenge our current models. This is not a bad thing. It’s just the way that science works. The new instrument provides a means to modify and enhance our current understanding, and hopefully allow us to learn lots of new physics! However, having said all that, there is a genuine ‘crisis’ in cosmology at the moment which demands attention, and this is the topic for this month’s blog post. It concerns the value of an important parameter which describes the expansion of the Universe called Hubble’s constant, which is usually denoted by Ho (H subscript zero). This is named after Edwin Hubble, the astronomer who first experimentally confirmed that the Universe is expanding. The currently accepted value of Ho is approximately 70 km/sec per Megaparsec. As discussed in the book (1) (pp. 57-59), Hubble discovered that distant galaxies were all moving away from us, and the further away they were the faster they were receding. This is convincing evidence that the Universe, as a whole, is expanding (1) (Figure 3.4). To understand the value of Ho above, we need to look at the standard units that are used to express it. I think we are all familiar with km/sec (kilometres per second) as a measure of speed, in this case the speed of recession of a distant galaxy. But what about the Megaparsec (Mpc for short) bit? A parsec (parallax second) is a measure of distance, and the ‘second’ refers to an angle rather than a second of time. If you take a degree (angle) and divide it by 60 you get a minute of arc. If you then divide the minute by 60 you get a second of arc. So a second of arc is a tiny angle, being one 3,600th of a degree. To understand how this relates to astronomical distances we need to think about parallax. There is a simple way to illustrate what this is. If you hold a finger up in front of your eyes, and then look at it alternatively with one eye and then the other, your finger will appear to move its position relative to the background. Furthermore, it will appear to change its position more when your finger is close to your face, than when it is further away. Keeping this simple observation in mind, the same principle of parallax can be applied to measuring the distance to nearby stars. The diagram below illustrates the idea.  Edwin Hubble. Credit: public domain Edwin Hubble. Credit: public domain If you observe the position of a star from opposite sides of the Earth’s orbit around the Sun it will appear to move relative to the background of distant stars. When the parallax angle P (shown in the diagram) takes the value of one second of arc, then trigonometry says that the star is 1 parsec away, which is about 3.26 light years. So, getting back to Hubble’s constant, Ho says that the speed of recession of galaxies increases by 70 km/sec for every Megaparsec they are distant, where a Megaparsec = a million parsecs = 3,260,000 light years. Therefore to determine the current value of Ho, you can observe a number of galaxies to estimate their distance and rate of recession and plot them on a graph as shown below. The slope of the resulting plot will give the value of Ho. Hubble was the first to do this in the 1920s, and his estimate was around 500 km/sec per Megaparsec – some way off, but still a remarkable achievement given the technology available at that time. However, having been somewhat distracted by the units in which Ho is expressed, what is the issue that I introduced in my second paragraph? There are currently two independent ways of measuring the value of Ho. The first of these, sometimes referred to as the ‘local distance ladder’ (LDL) method, is essentially the process we have already described. We establish an observational campaign where we measure the distances and rates of recession of many galaxies, spread across a large range of distances, to estimate the ‘slope of the plotted curve’ as described above. 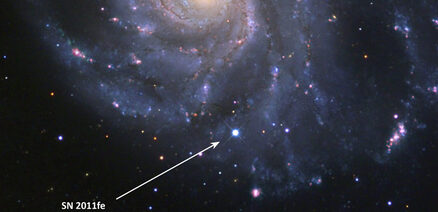 A Type 1a supernova in M101, 21 million light years distant. Credit: B.J. Fulton/Las Cumbres Observatory Global Telescope Network. A Type 1a supernova in M101, 21 million light years distant. Credit: B.J. Fulton/Las Cumbres Observatory Global Telescope Network. However, this is not as easy as it sounds – measuring huge distances to remote objects in the Universe is problematic. To do this, astronomers rely on something called the ‘local distance ladder’, as mentioned above. The metaphor of a ladder is very apt as the method of determining cosmological distances involves a number of techniques or ‘rungs’. The lower rungs represent methods to determine distances to relatively close objects, and as you climb the ladder the methods are applicable to determining larger and larger distances. The accuracy of each rung is reliant upon the accuracy of the rungs below. For example, the first rung may be parallax (accurate out to distances of 100s of light years), the second rung may be using cepheid variable stars (1) (p. 58) (good for distances of 10s of millions of light years), and so on. The majority of these techniques involve something called ‘standard candles’. These are astronomical bodies or events that have a known absolute brightness, such as cepheid variable stars and Type Ia supernovae (the latter can be used out to a distance of about a billion light years). The idea is that if you know their actual brightness, and you measure their apparent brightness as seen from Earth, you can easily estimate their distance. This summary is a rather simplified account of the LDL method, but hopefully you get the idea. 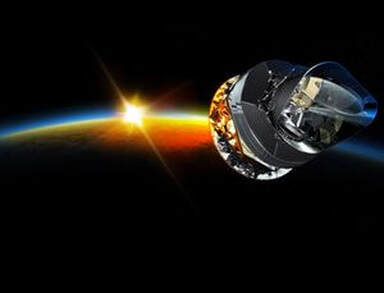 The ESA Planck space telescope. Credit: ESA. The ESA Planck space telescope. Credit: ESA. The second method to estimate the value of Ho employs a more indirect technique using the measurements of the cosmic microwave background (CMB). As discussed in the book (1) (pp. 60-62) and in the May 2023 blog post, the CMB is a source of radio noise spread uniformly across the sky, that was discovered in the 1960s. At that time, it was soon realised that this was the ‘afterglow’ the Big Bang. Initially this was very high energy, short wavelength radiation in the intense heat of the early Universe, but with the subsequent cosmic expansion, its wavelength has been stretched so that it current resides in the microwave part of the electromagnetic spectrum. The characteristics of this radio noise has been extensive studied by a number of balloon and spacecraft missions, and the most accurate data we have was acquired by the ESA Planck spacecraft, named in honour of the physicist Max Planck who was a pioneer in the development of quantum mechanics. The map of the radiation produced by the Plank spacecraft is shown below. The temperature of the radiation is now very low, about 2.7 K (2), and the variations shown are very small – at the millidegree level (3). The red areas are the slightly warmer regions and the blue slightly cooler. To estimate the value of Ho based on using the CMB data, cosmologists use what they refer to as the Λ-CMD (Lambda-CMD) model of the Universe – this is what I have called ‘the standard model of cosmology’ in the book (1) (pp. 63 – 67, 71 – 76). This model assumes that Einstein’s general relativity is ‘correct’ and that our Universe is homogenous and isotropic (the same everywhere and in all directions) at cosmological scales. It also assumes that our Universe is geometrically flat and that it contains a mysterious entity labelled dark matter that interacts gravitationally, but otherwise weakly, with normal matter (CDM stands for ‘cold dark matter’). It also supposes that there’s another constituent called dark energy (that’s the Λ bit, Λ being Einstein’s cosmological constant (1) (pp. 55, 56)), which maintains a constant energy density as the Universe expands. So, how do we get to a value of Hubble’s constant from all this? We start with the CMB temperature map, which corresponds to an epoch about 380,000 years after the Big Bang. The blue (cooler and higher density) fluctuations represent the structure which will seed, through the action of gravity, the development of the large-scale structure of stars and galaxies that we see today. The idea is that using the CMB data as the initial conditions, the Λ-CMD model is evolved forward using computer simulation to the present epoch. This is done many times while varying various parameters, until the best fit to the Universe we observe today is achieved. This allows us to determine a ‘best fit value’ for H0 which is what we refer to as the CMB value. Now, we get to the crunch – what exactly is the so-called ‘crisis in cosmology’? The issue is illustrated in the diagram below, which charts the value of Ho using the two methods from the year 2000 to the present day from various studies. The points show the estimated value of Ho and the vertical bars show the extent of the ±1σ errors in these values. It can be seen that the two methods were showing reasonable agreement with each other, within the bounds of error, until around 2013. However, thereafter the more accurate estimates have diverged from one another. The statistics say that there is a 1 in 3.5 million chance that this situation is a statistical fluke – in other words there is confidence at the 5σ level that the divergence is real. Approximate current values of Ho using the two methods are: Ho = 73.0 km/sec per Mpc (LDL), Ho = 67.5 km/sec per Mpc (CMB). This is quite a considerable difference, which influences the resulting model of the Universe. For example, mathematicians among my readers will notice that the inverse of Ho has units of time, and in fact this give a rough measure of the age of the Universe. Our best estimate of the age of the Universe currently is around 13.8 billion years, and the approximation, based on the inverse of Ho, for the LDL method is 13.4 billion years, and that for the CMB method 14.5 billion years. So, roughly a billion years difference in the age estimate between the two methods. So, what can we deduce from all this? Well, put succinctly:
Either (1) the LDL method for estimating cosmic distances is flawed, Or (2) our best model of the Universe (the Λ-CMD model) is wrong. Either way, it looks like this divergence in the estimates of Ho will provoke further experimental work to try to understand and resolve the issue. It is certainly the case that JWST’s greater angular resolution can aid in trying to resolve the crisis by investigating the various rungs of the LDL in unprecedented detail. At the time of writing there are various proposals for telescope time in the pipeline to look at this, and some observational campaigns underway. Alternatively, if the Λ-CMD model turns out to be flawed, it will be a shock, but then hopefully it will present an opportunity for scientists to learn lots of new physics. As always, things are not straight-forward and the ‘crisis’ may have far-reaching implications for our understanding of the Universe in which we live. Graham Swinerd Southampton, UK August 2023 (1) Graham Swinerd and John Bryant, From the Big Bang to biology: where is God?, Kindle Direct Publishing, 2020. (2) The Kelvin temperature scale is identical to the Celsius scale but with zero Kelvin at absolute zero (-273 degrees Celsius). Hence, for example, water freezes at +273 K and boils at +373 K. (3) A millidegree is 1 thousandths of a degree.
0 Comments
|
AuthorsJohn Bryant and Graham Swinerd comment on biology, physics and faith. Archives
July 2024
Categories |

 RSS Feed
